Over one third of people affected by neglected tropical diseases (NTDs) live in Africa. These diseases have a profound effect on people’s lives; they cause immeasurable suffering, prevent adults from being able to work, and children from being able to go to school.
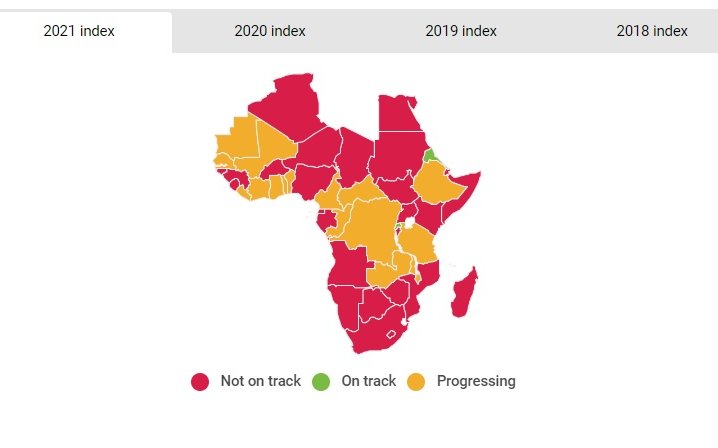
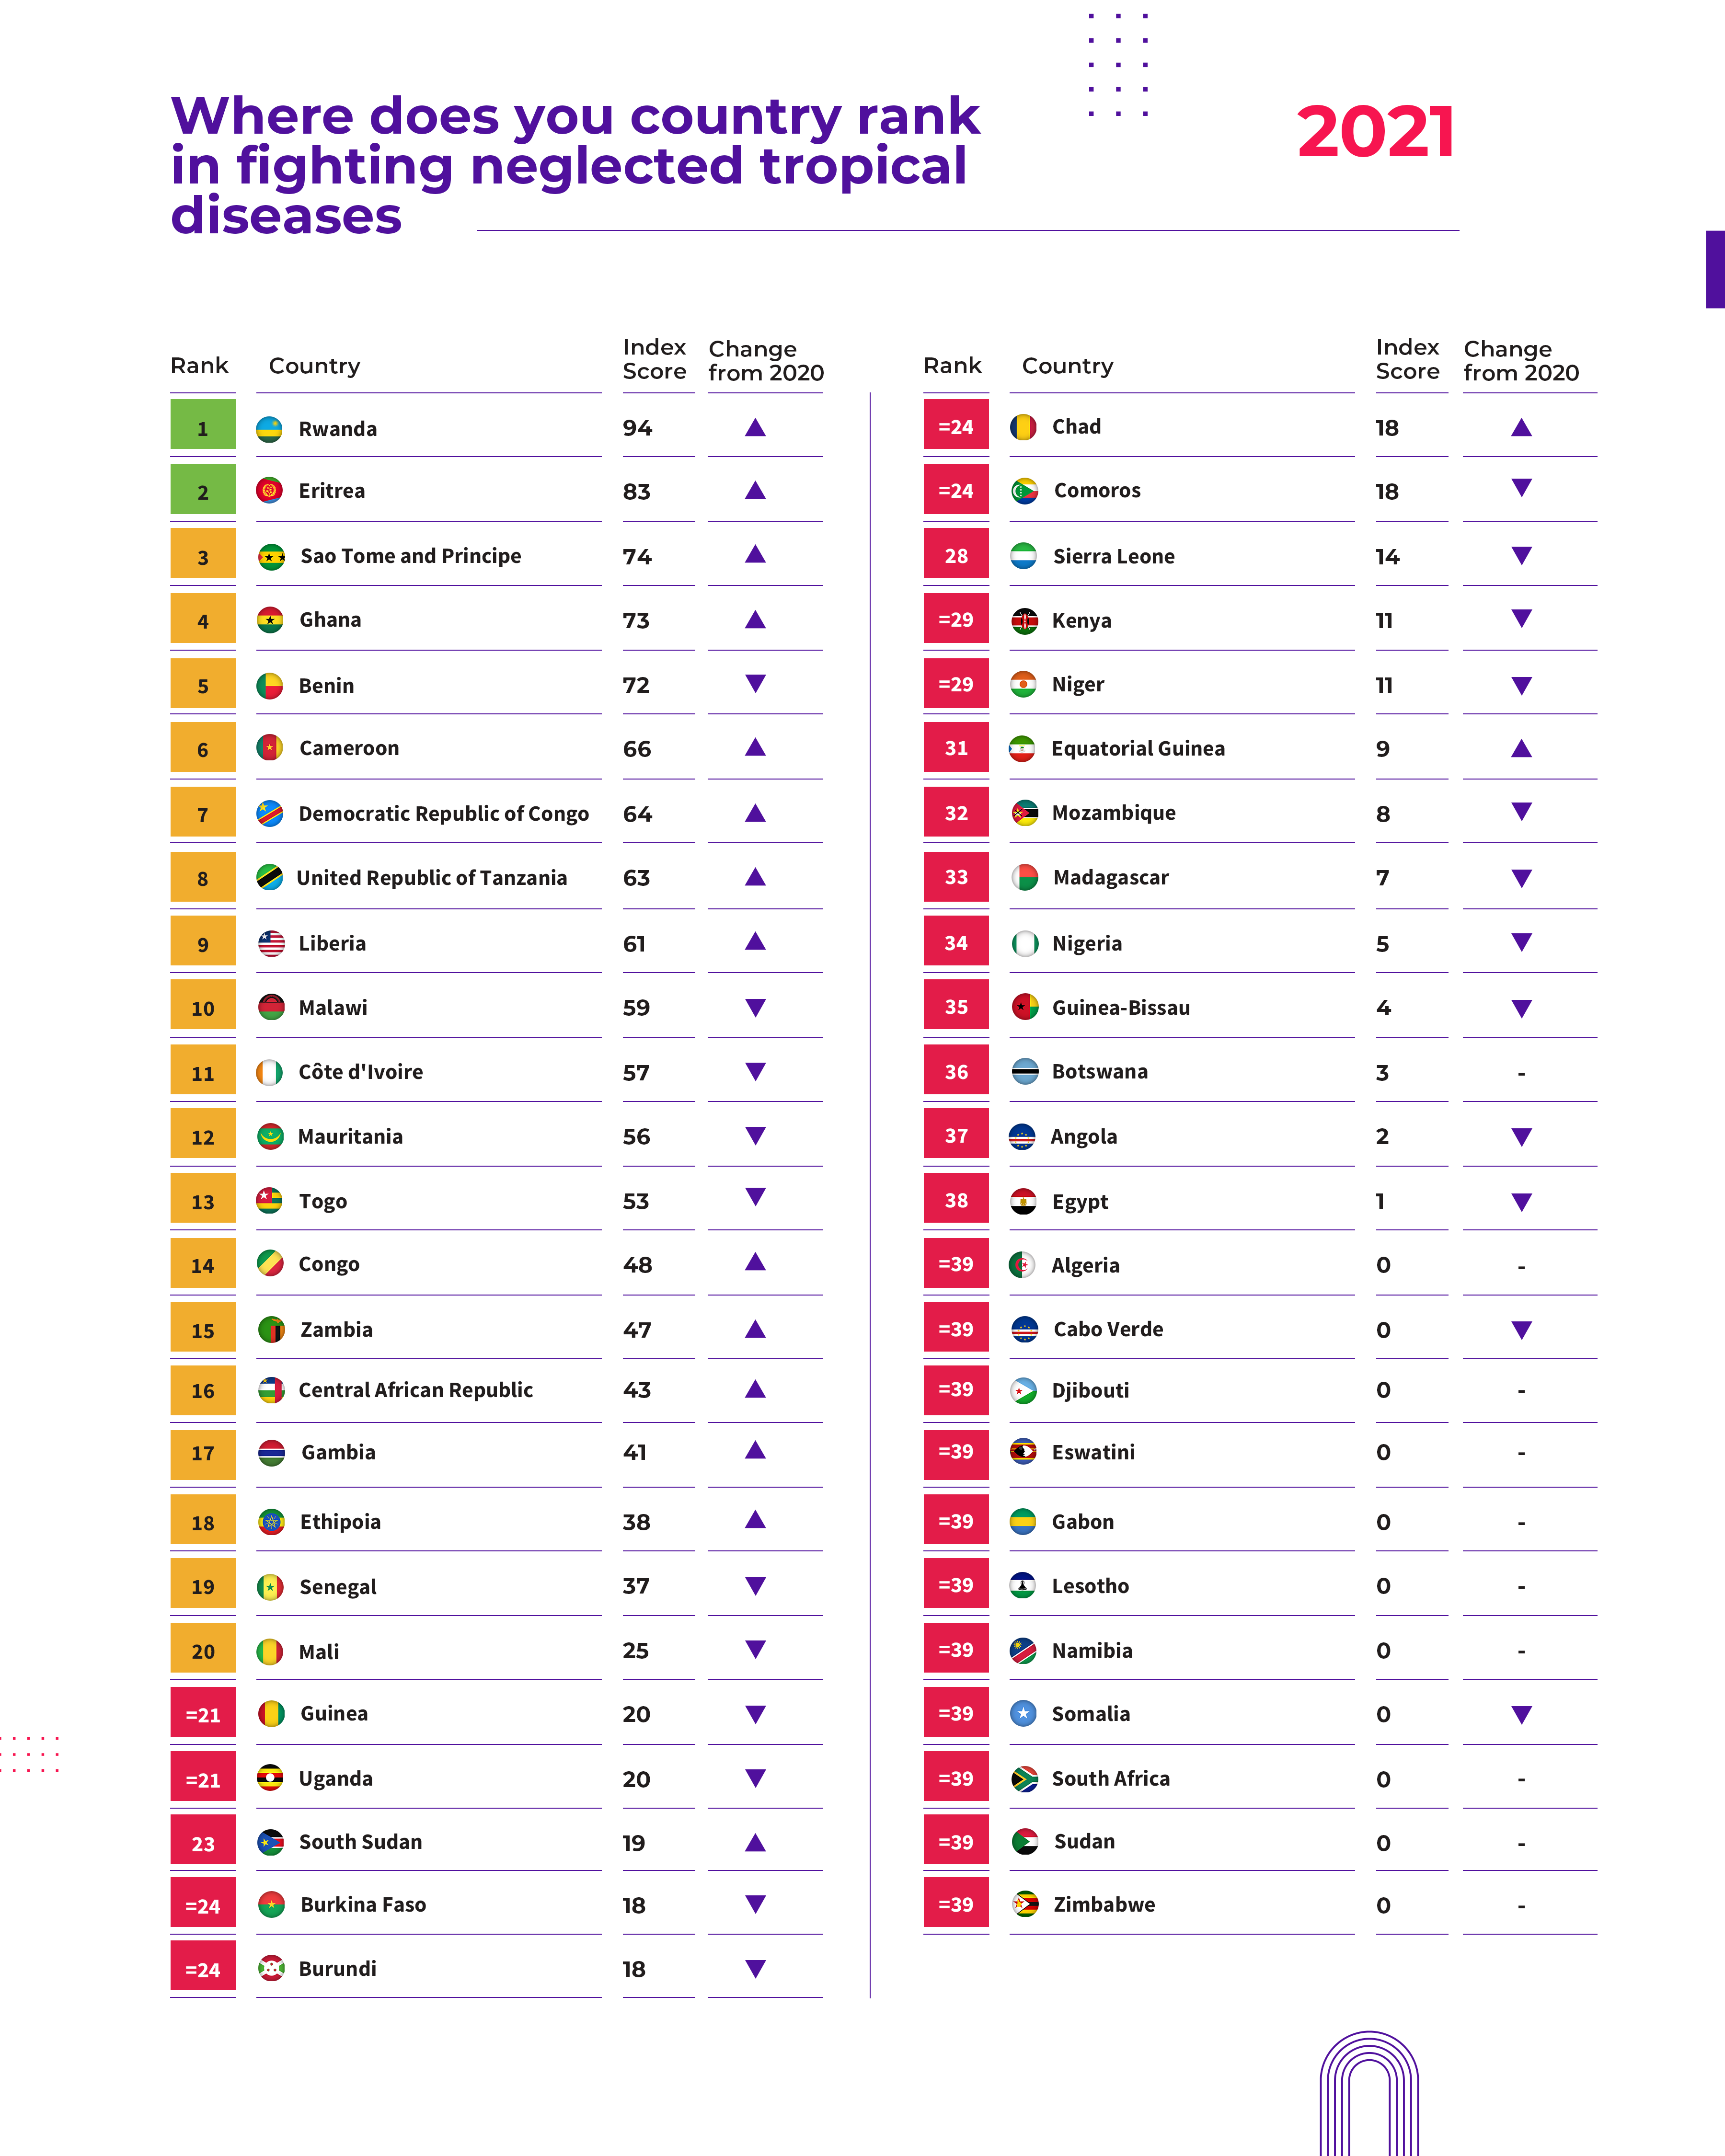
The league table below shows current country rankings, and the map below shows the change in country ranking over the past five years.
It is striking to note that the richest countries are the poorest when it comes to fighting NTDs. Sub-Saharan Africa countries with modest or low gross domestic products (GDPs) like Chad, Burkina Faso, and Burundi are outperforming wealthier nations in the fight against neglected tropical diseases (NTDs).
What is the Africa NTD league table
The league table uses the NTD index scores and ranks countries in a league table. The purpose of the league table is to demonstrate year on year progress across countries and the 5 diseases. It also acts as an advocacy tool to celebrate and encourage countries with their NTD efforts. However, it should be noted that the index is still a number and cannot reveal all the complexities of a national NTD programme, such as delayed arrival of medicines requiring postponement of MDA etc. Therefore, some care should be taken in making comparisons between countries and within countries over time.
2021 league table
How is the NTD Coverage index calculated and where does the data come from?
The NTD coverage index has been developed by the World Health Organization (WHO). It uses an average (geometric mean) of the national coverage percentage for the 5 Preventative Chemotherapy NTDs (Bilharzia, elephantiasis (lymphatic filariasis) intestinal worms, river blindness, trachoma) coverage data that that is routinely reported by individual countries to WHO.
Why use the geometric mean to determine the average coverage?
The geometric mean is a common method used to measure a country’s average progress across multiple elements. For example it is used for the UN's Human Development Index. Compared to an arithmetic mean, the geometric mean is better suited for this kind of index. It prevents high coverage of one disease from compensating for very low coverage of other diseases. The WHO’s methodology for calculating the index includes making some manual adjustments to the coverage percentages, for example a country that has prepared a dossier for elimination will have a coverage of 0% but this is ‘upgraded’ to 100%.
What do the index scores and colour coding mean?
Indicators on the Scorecard are ranked based on a traffic light system developed by WHO for the average coverage. Green (coverage more than 75%) indicates that a country target is on track; yellow (coverage between 25-75%) indicates that progress has been made but more effort is required; and red (coverage below 25%) indicates that target is not on track.